How to Read Consumption Graphs: Recognizing Patterns and Spotting "Hidden" Power-Hogging Appliances

You have installed your smart meter (e.g. Shelly, Sonoff or grid operator meter) and you finally have data. You open the app on your mobile phone or computer and you see in front of you colorful lines that go up and down, bars and numbers.

Data collection is only the first step. If you don't know how to interpret this data, it's like having an X-ray without being a doctor.

As engineers, we see the power consumption graph as an electrocardiogram of your home. Each device that turns on or off leaves its own unique "footprint" or "signature" on this graph. Let's see how you can learn to read these lines so you can immediately spot the devices that are costing you money.

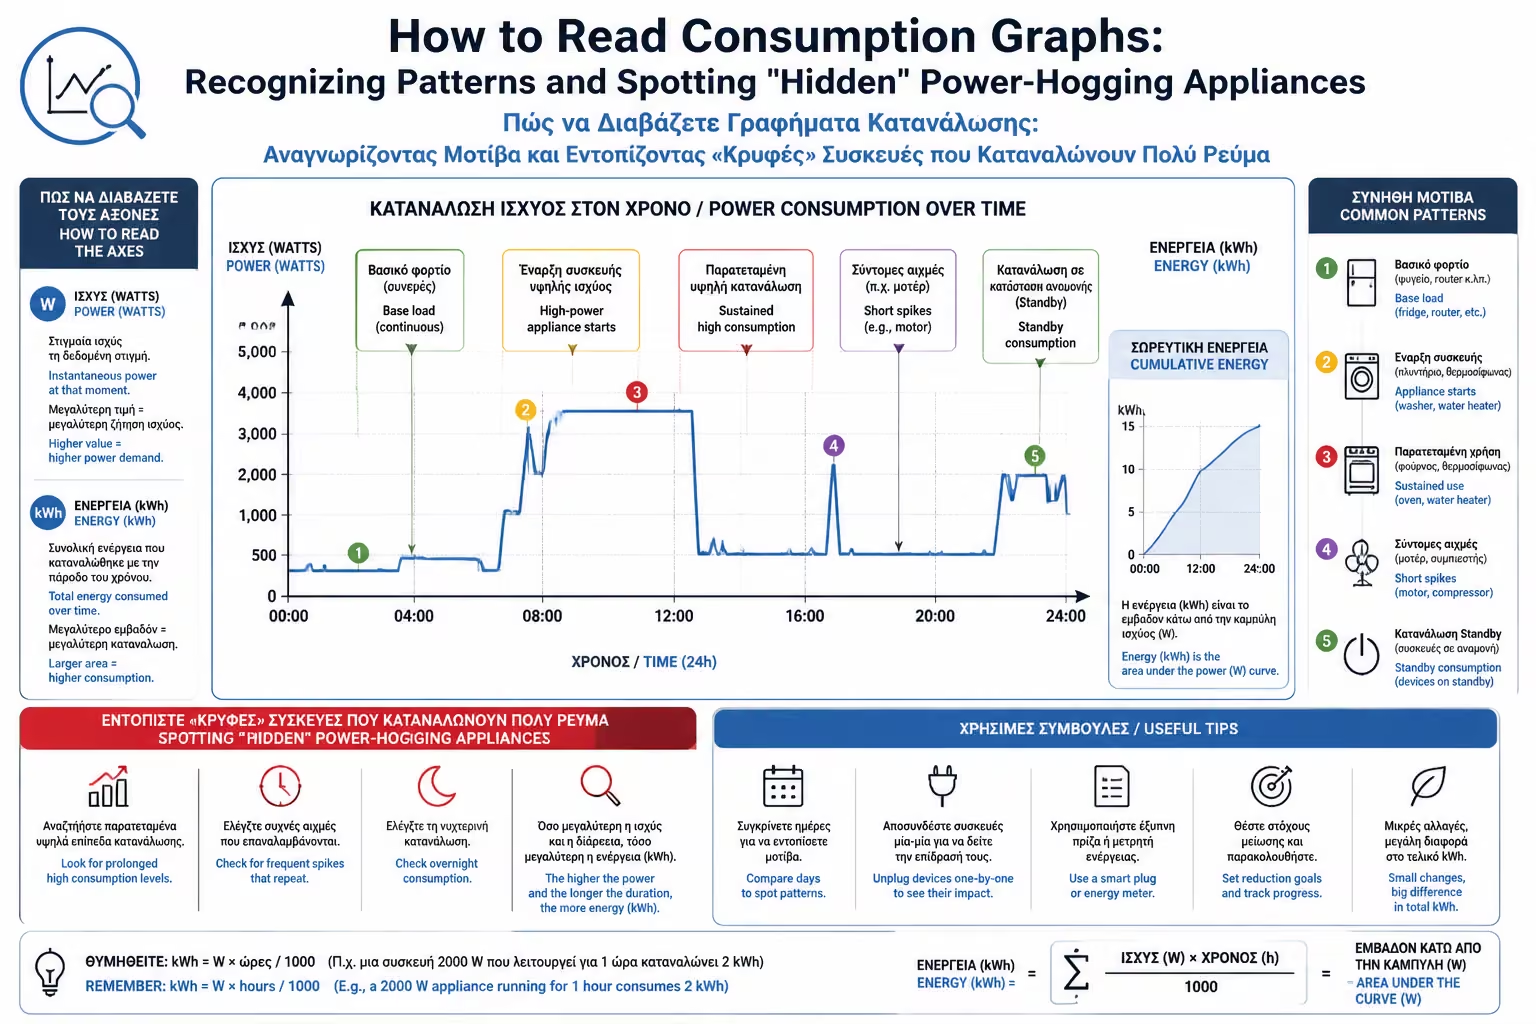
1. The Basics: Power (W) vs Energy (kWh)

The first mistake that users make is that they confuse the two main charts that the applications offer.

Illustration for 1. The Basics: Power (W) vs Energy (kWh)

The Real Time Graph (Live / Instantaneous Power)

This chart is usually a continuous line (Line Chart). On the vertical axis you see Watts (W) or Kilowatts (kW) and on the horizontal axis the minutes of the hour. This graph shows you "what's happening RIGHT NOW" or "how much electricity the house was drawing yesterday at exactly 3:32 PM". It is the best tool to identify devices.

The History Graph (Power Consumption)

Here we usually see Bars (Bar Charts). Each bar represents an entire day (or month) and the vertical axis measures Kilowatt hours (kWh). This chart shows you "how much you will pay at the end of the month".

2. Device Signatures

Illustration for 2. Device Signatures

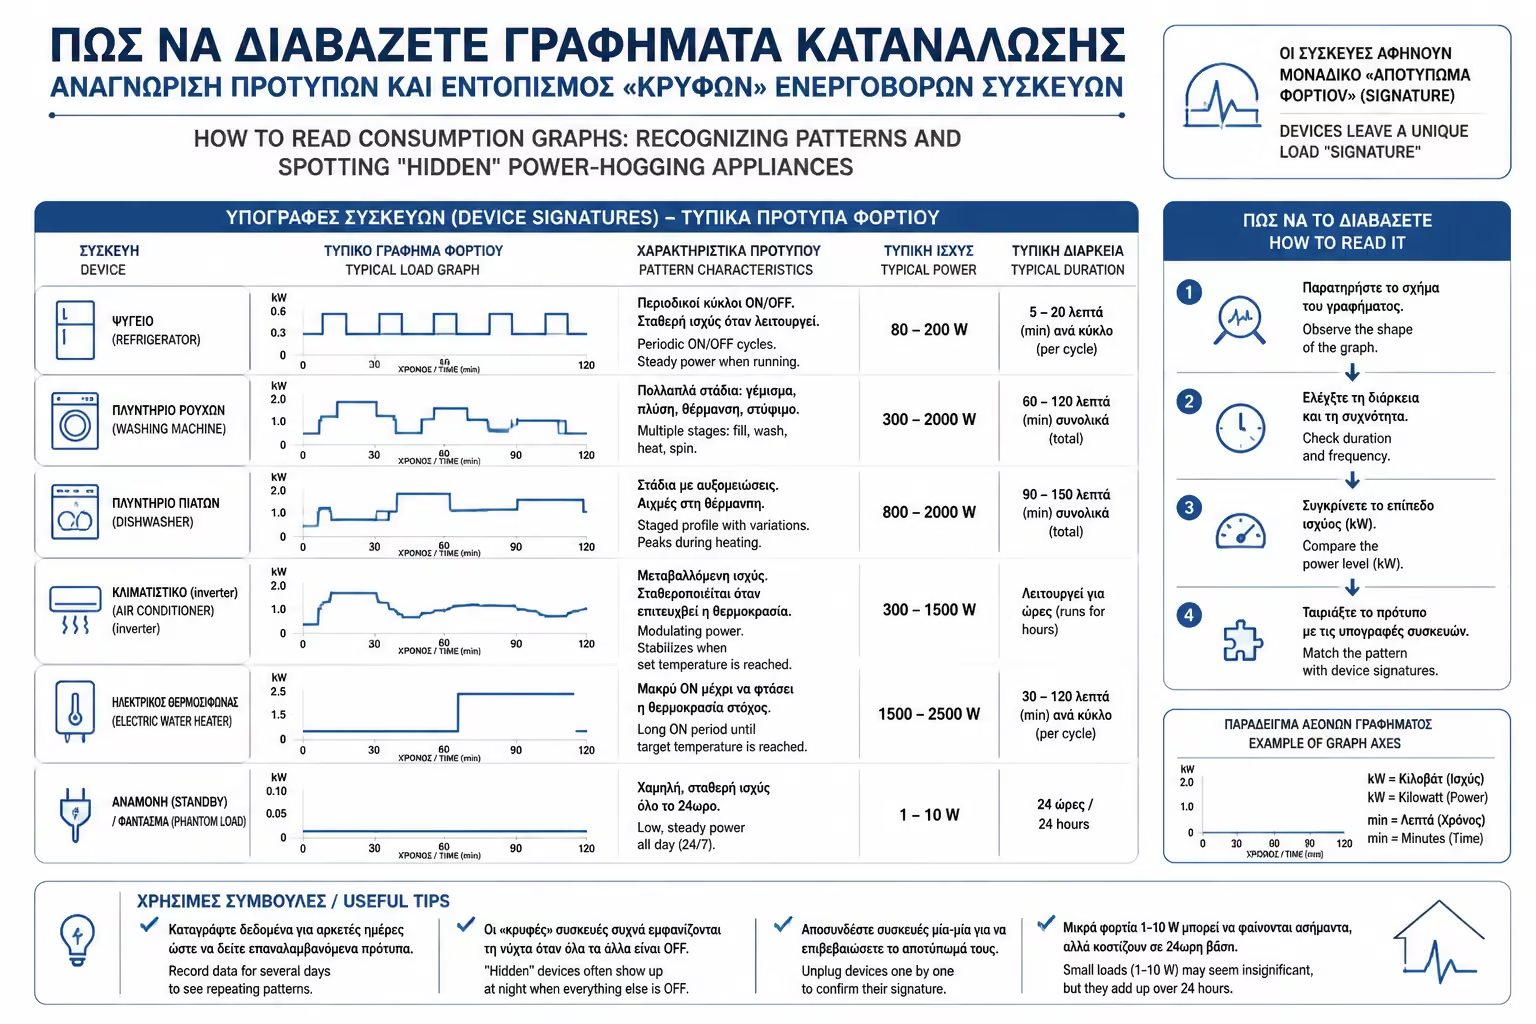
When looking at the real-time chart (the Watts line), look for the following 4 classic patterns. If you recognize them, you know exactly which device is working, without even being at home!

The Fridge: "The Heartbeat"

The fridge doesn't work all the time. Its compressor turns on to lower the temperature and then turns off. The Pattern: A small, sharp spike at 100W - 200W, which stays steady for about 20-30 minutes, then drops off to zero. This "square" repeats rhythmically around the meter, like a heartbeat. Fault Diagnosis: If you see that "square" never goes out, and the line stays at 150W for hours, your cooler has a problem! Either the door rubbers are broken and it's losing cooling, or it needs freon, causing it to burn electricity non-stop.

The Electric Water Heater: "The Great Plateau"

It is the easiest pattern to spot because of its sheer size. * The Pattern: The line violently shoots upwards (by 3000W to 4000W) within a second. It stays perfectly flat (like a plateau) for as long as the water heats up (eg 45 minutes). Once the thermostat reaches 60°C, the line collapses vertically downwards.

The Resistance Furnace: "The Teeth of the Saw"

The oven maintains its temperature by flashing its resistors. * The Pattern: An initial high peak (eg 2500W) for 10-15 minutes (warm-up). Once it reaches 200°C, it drops to zero. After a while it rises again for 2 minutes, falls again, etc. On the graph, this looks like dense saw teeth.

The Inverter Air Conditioner (A/C): "The Smooth Hill"

Modern inverters do not work with on/off, but increase and decrease the revolutions of their motor. * The Pattern: When you turn it on, the bar goes up like a smooth curve (eg it reaches 1200W). As the room cools, the line begins to slowly "slide" down and eventually stabilizes at a very low point (eg at 300W), where it remains as a slightly wavy, flat line.

3. Vampire Power: The "Black Hole" of the Night

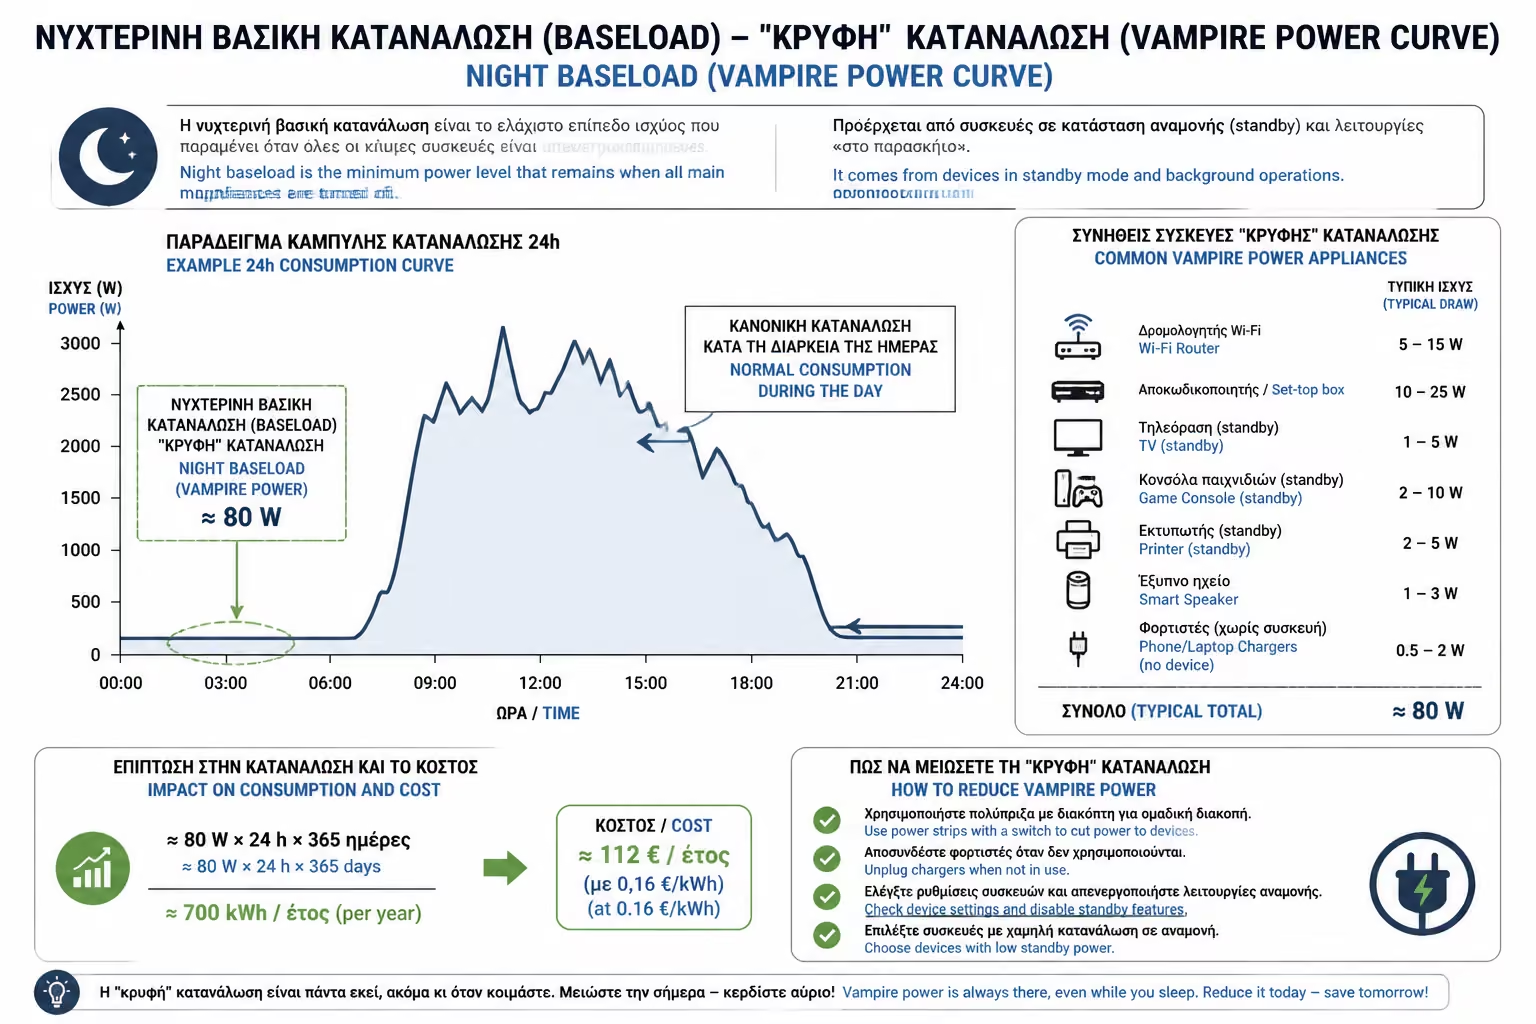
The most useful thing you can do with your chart is to look at it when the house is "sleeping" (eg at 04:00 in the morning).

At that time, expect the consumption to be zero (or see only the fridge pulse). This minimum nightly consumption is called Base Load. If you see that your baseline never drops below 300 watts, you have a problem. That 300 Watts is "Vampire Power" – devices that suck up energy without doing anything useful:

  • Computers and monitors that stay in "Sleep mode" (or just plugged in).
  • TV Amplifier, Home Cinema, TV Boxes, Cosmote/Nova Decoder.
  • Dozens of chargers forgotten in the sockets.
  • The old modem/router.

The math of waste: A permanent "invisible" load of 300W, means 0.3 kW x 24 hours = 7.2 kWh per day! That is 216 kWh per month, literally thrown in the trash (more than 35-40 euros/month without even turning on the lights).

Illustration for 3. Vampire Power: The "Black Hole" of the Night

4. The Search for "Hidden" Consumptions (Diagnostic Method)

Illustration for 4. The Search for "Hidden" Consumptions (Diagnostic Method)

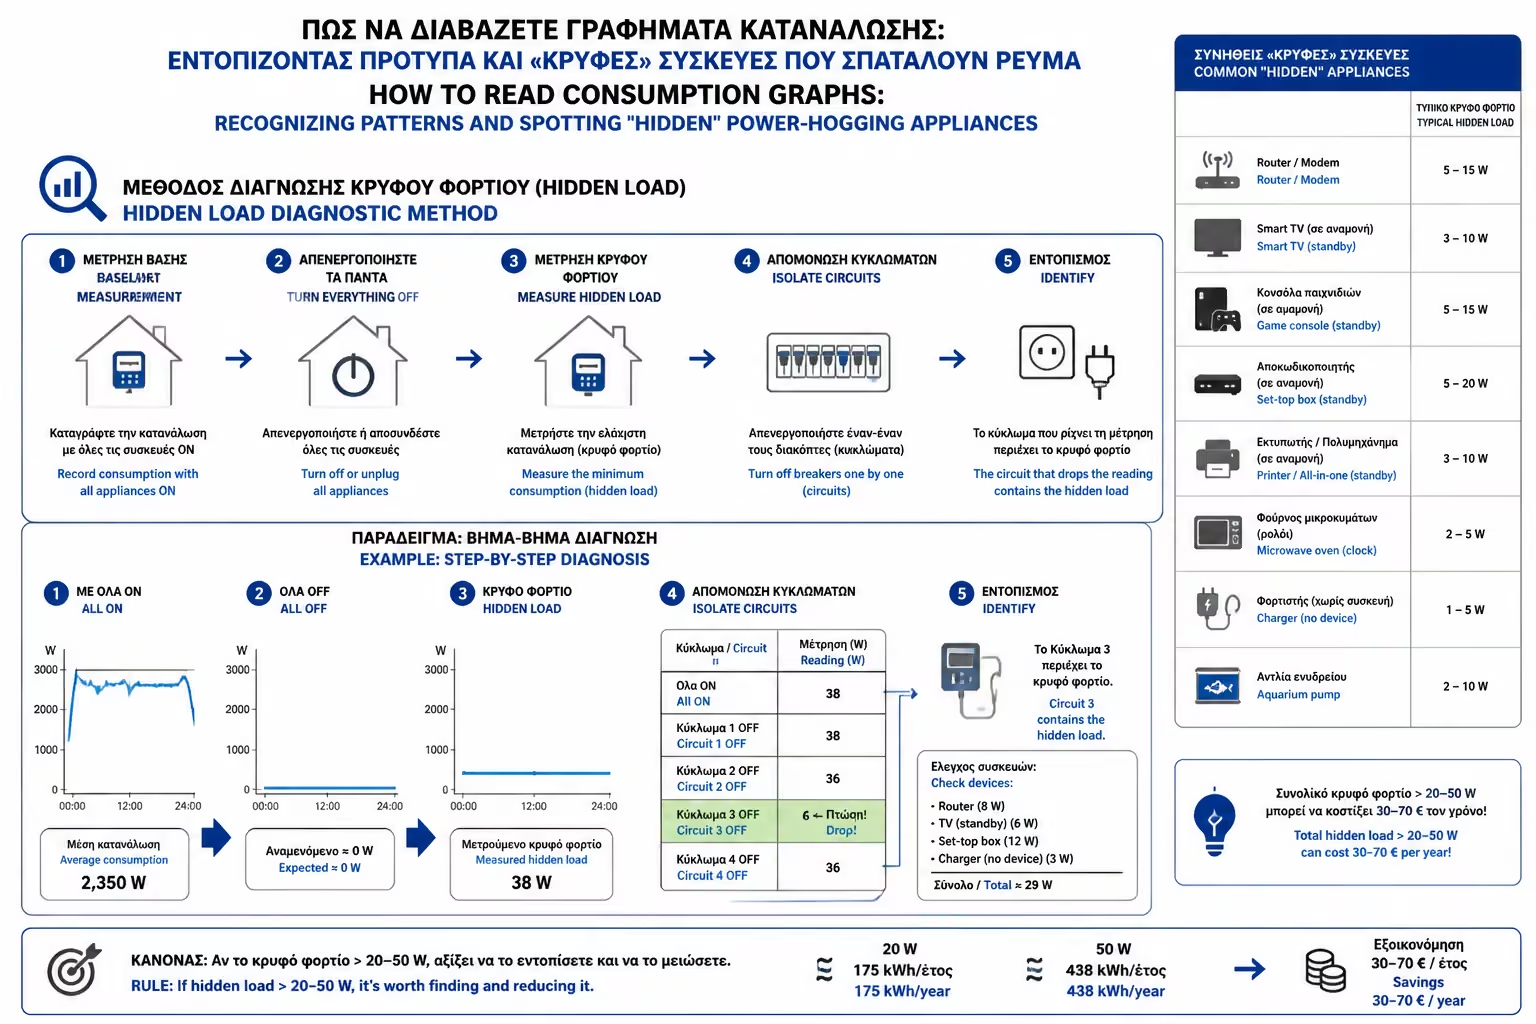
If you see an inexplicably high baseline and don't know what's wrong, apply the Breaker Test:

  1. Open the Live Chart on your mobile.
  2. Go to the electrical panel and take down the fuses one by one (except for the internet and refrigerators).
  3. Once you've blown a fuse (eg the living room one) and see the graph suddenly "dip" by 150W... you've just found the culprit.
  4. Go into the living room, unplug an appliance, flip the fuse and see if the line stays low. Continue until you find the exact device.

Summarizing

Energy graphs aren't just pretty pictures for tech-freaks. It is the most powerful tool in your hands to fight waste. By learning to recognize the "signatures" of devices and dropping the "Base Load" as low as possible, you can reduce your bill by up to 20% without changing anything at all in the way you live and use your home.

Next Step: You have the data, but now you want to gather it all (power, water, temperatures) on one great central screen. This is where open technology comes into play.

We continue to the ultimate smart home guide: Home Assistant & Energy Dashboard: Setting up the ultimate, central control center for your home's consumption.

Related Articles

Preview