Simplicity
You see the instantaneous power (Watts) of that moment in one big, clear number.
In the previous chapter we praised Home Assistant as the ultimate tool. The truth, however, is that not everyone has the time, the technical knowledge or the inclination to buy servers and "write" code on the weekends.
For 90% of consumers, Smart Home starts and ends with the application (App) they download for free on their mobile from the App Store or Google Play, when they buy a smart meter.
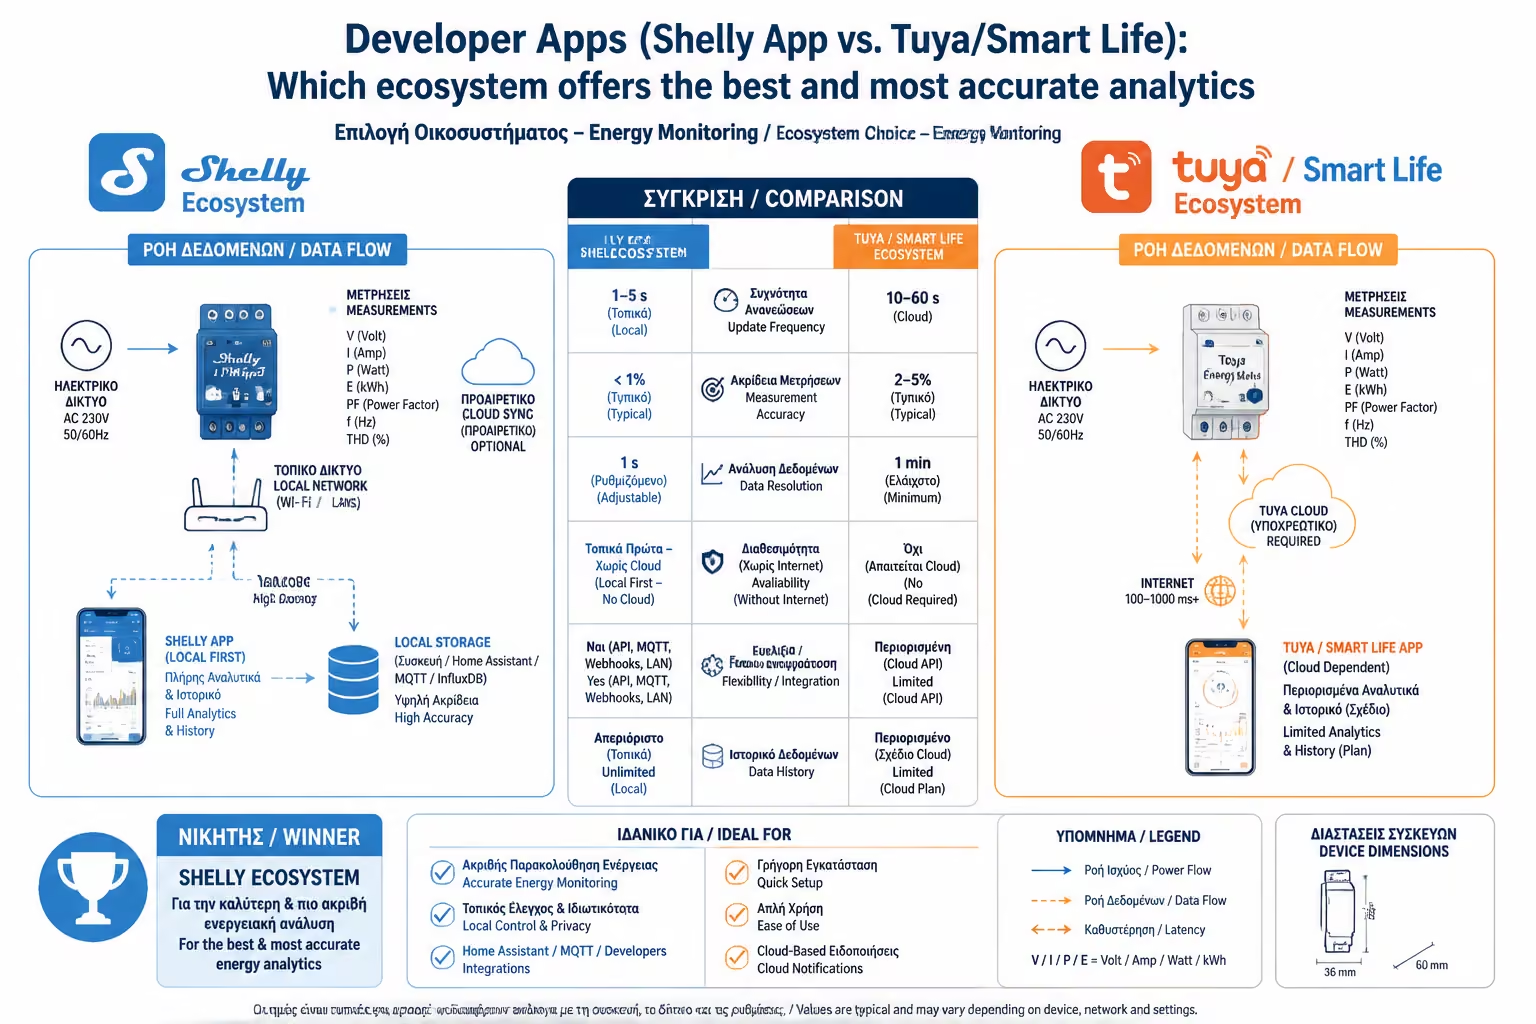
But not all apps are created equal. When we talk about energy analytics, the market is effectively split into two major camps: Shelly's ecosystem and the massive Tuya/Smart Life platform. As engineers who work with both every day, let's see which one makes more sense if you really care about analyzing consumption.
If you have bought a cheap smart socket or switch from the internet, 99% of them use Tuya's platform (the app is usually called _Smart Life_ or _Tuya Smart_). Tuya is not a manufacturer, but a software platform that thousands of factories rent to make their devices "smart".
What it offers you in Energy:
The Shortcomings (Why it doesn't work for professionals):
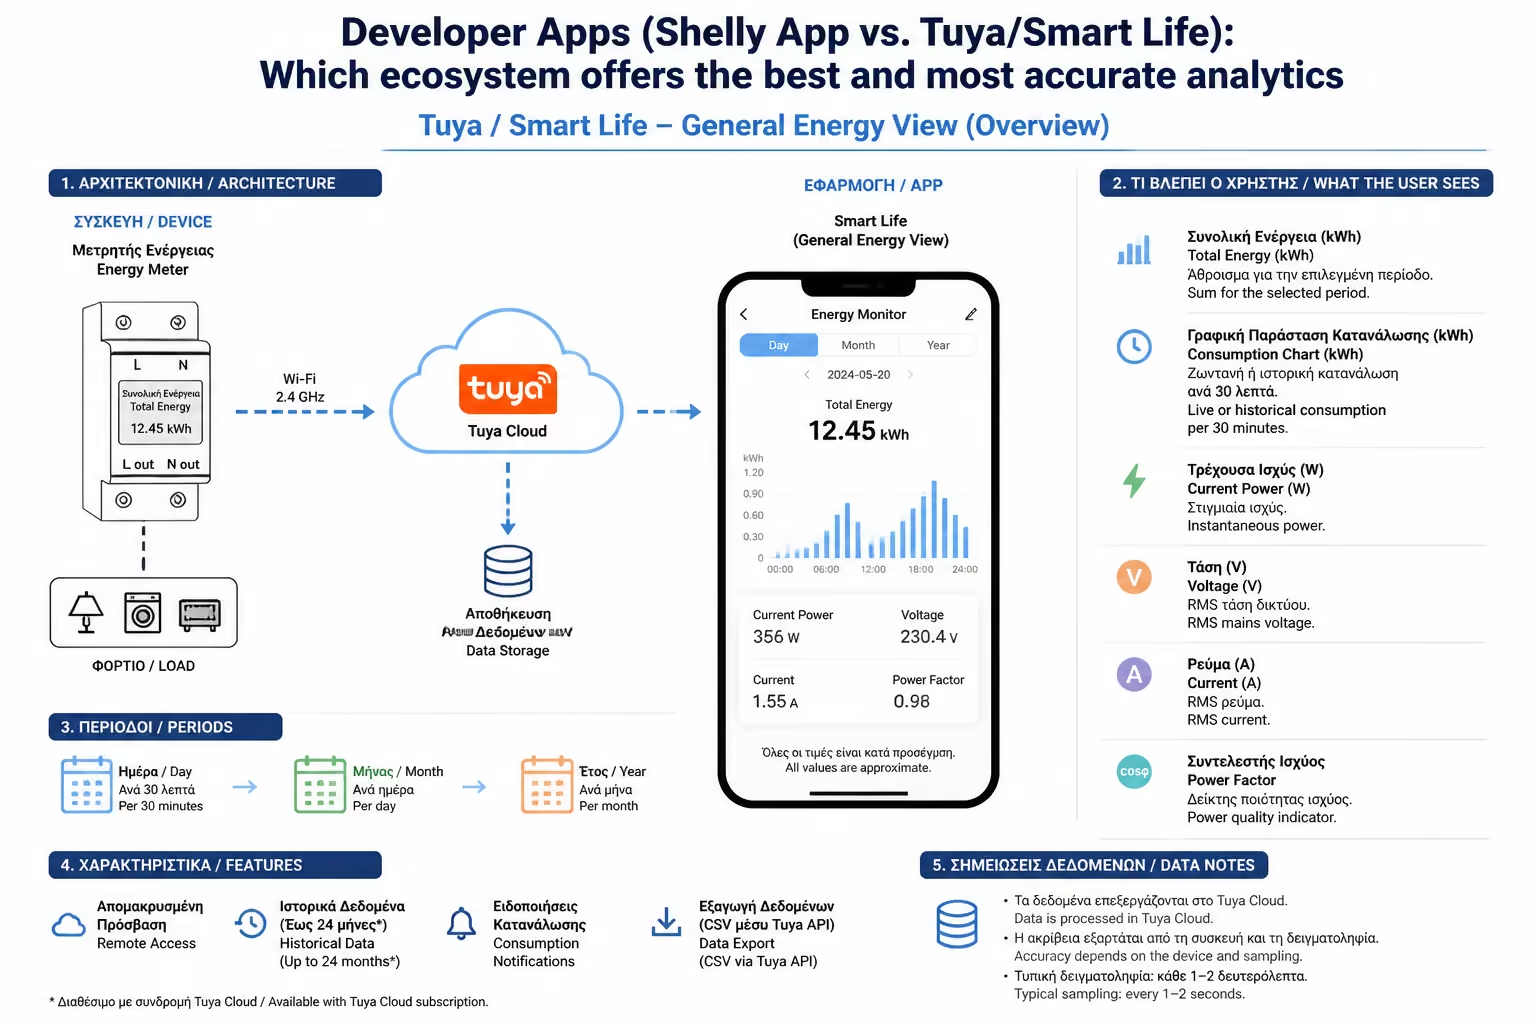
You see the instantaneous power (Watts) of that moment in one big, clear number.
It usually gives you a simple bar graph showing the total consumption (kWh) per day or per month.
Energy metering is just an "extra" feature. It rarely gives you graphs for voltage (Volts) or Amperes (critical for diagnosing electrical panel problems).
Charts are usually refreshed hourly. You cannot zoom in to see exactly what happened between 14:00 and 14:05.
On most Tuya devices, data is "locked" inside the app. Exporting them to an Excel file is rare to impossible (depending on the device manufacturer).
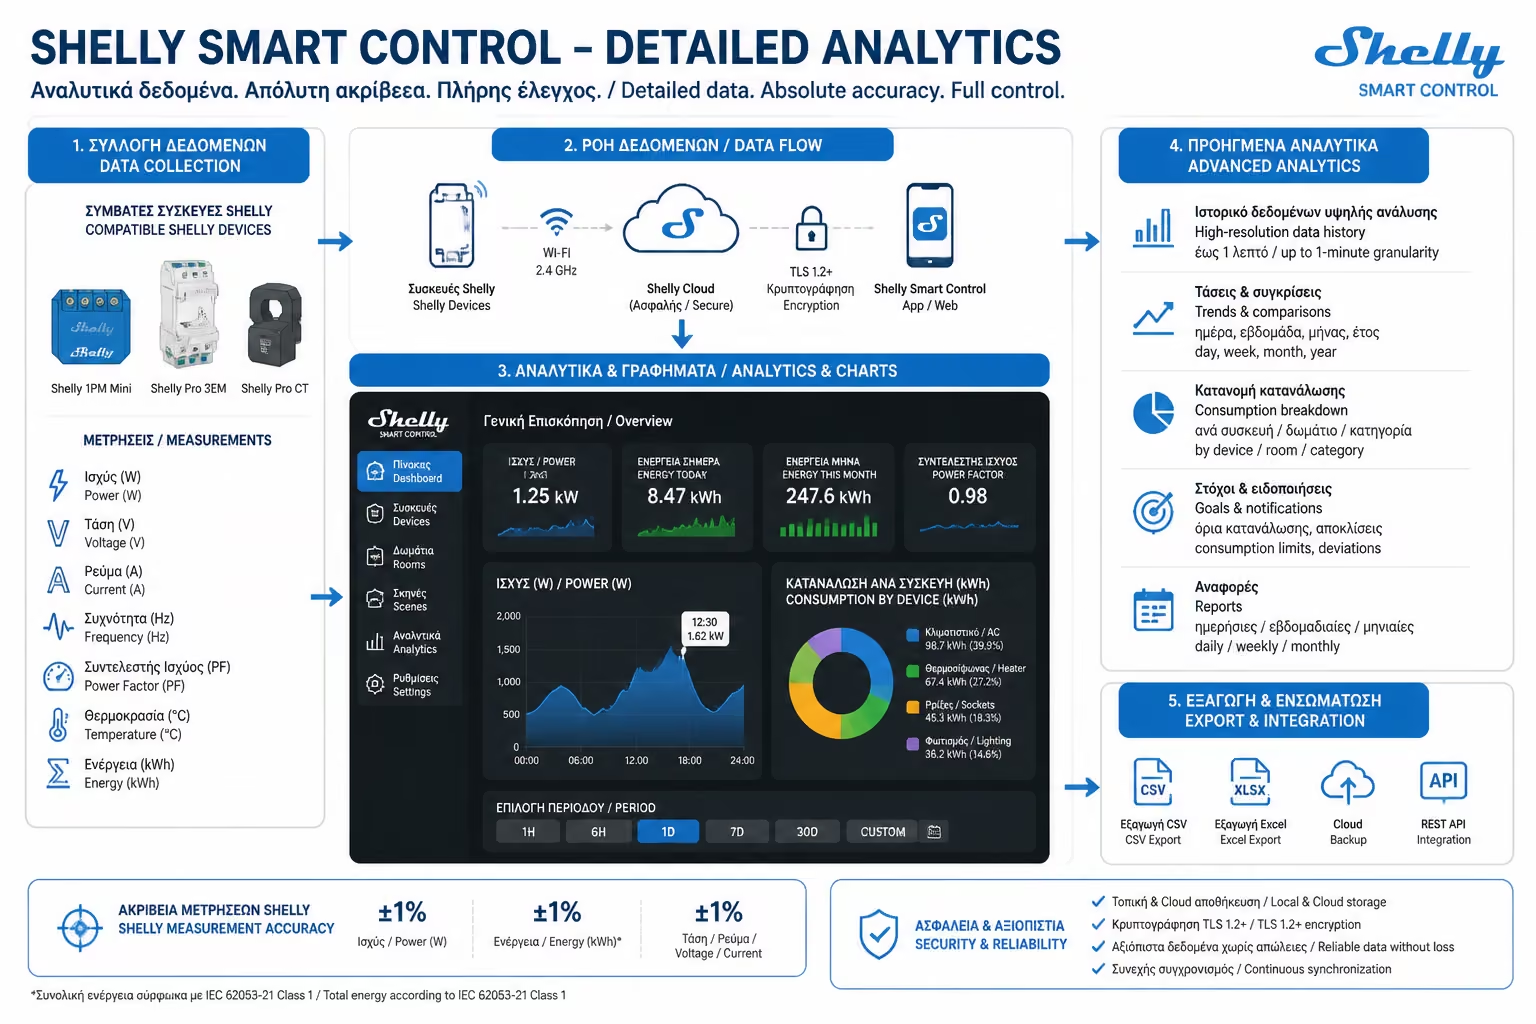
Shelly, from Allterco Robotics in Europe, took a completely different path. Its products were built with electricians, DIY users and engineers in mind, and the Shelly Smart Control app reflects that philosophy clearly.
Why it dominates Energy Analytics:
In Shelly's App you don't just see kilowatt hours. You have live graphs for Watts, Volts, Amperes and Power Factor (cosφ) for each measurement channel separately.
You can zoom in on the graph and see consumption down to the minute! This is the tool with which you will detect the "Vampire Power" or "cardiogram" of the refrigerator that we talked about in the previous chapter.
With a button inside the app, Shelly can send your consumption history, often up to one year back, as a CSV file to your email, ready for analysis.
Even if Shelly's servers go down, you can type the device's IP into your computer's browser (connected to the same Wi-Fi) and view metrics and data locally.
Entering 2026, companies started charging for "extra" features (SaaS model).
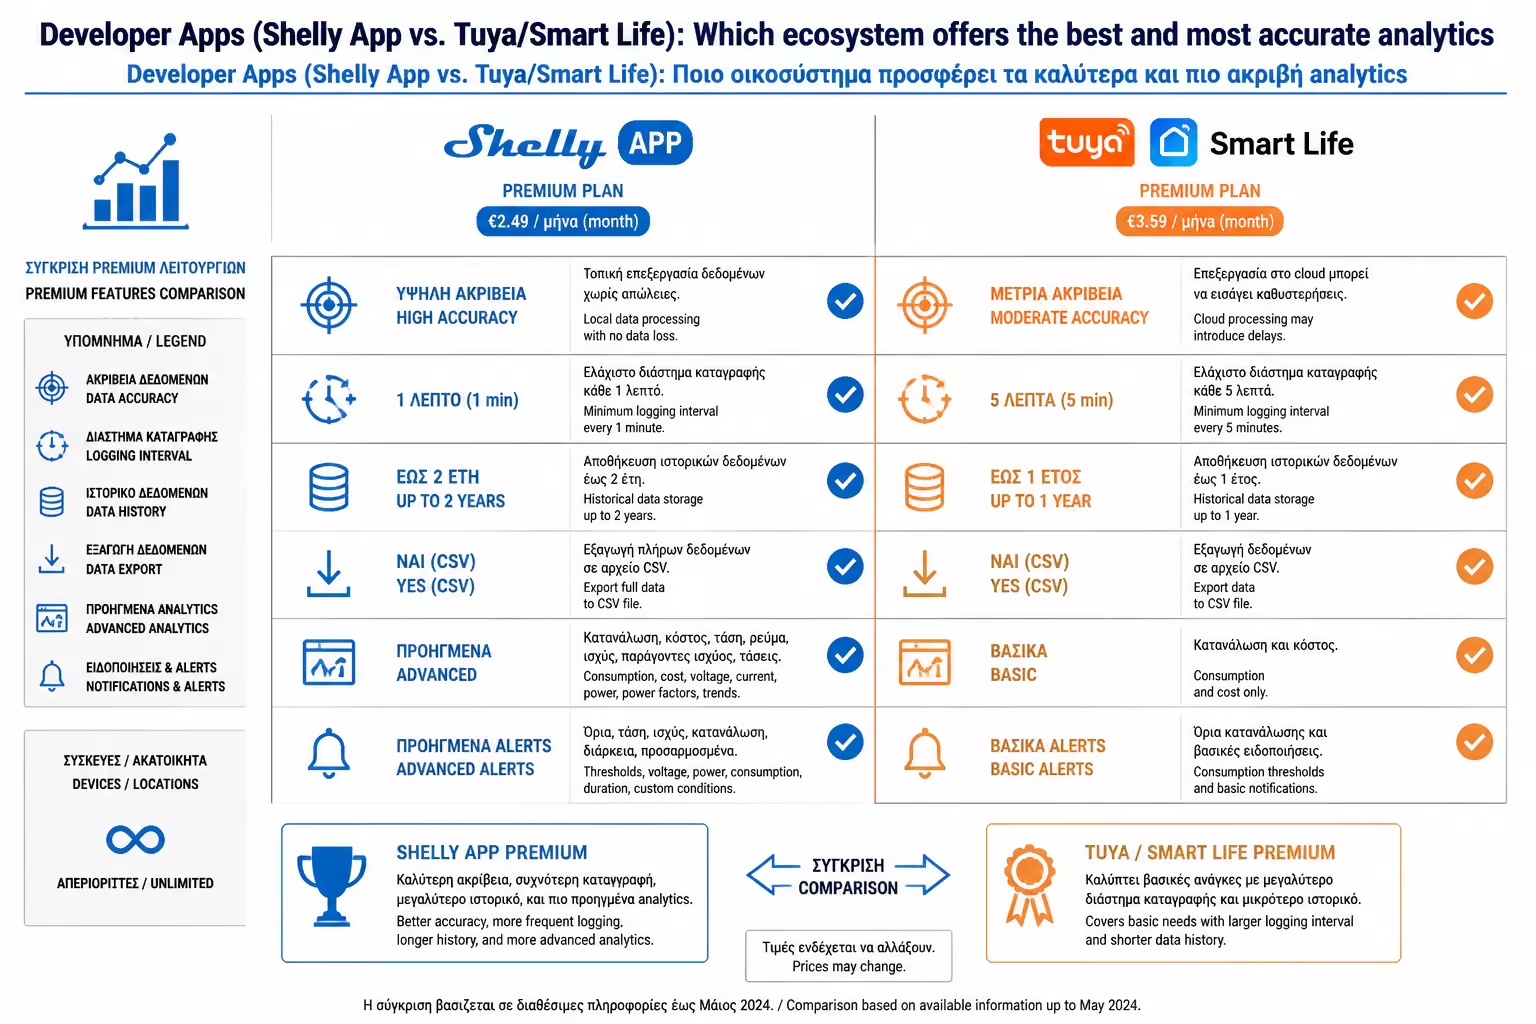
The answer here is absolutely clear:
If you simply want to switch lights from your phone and get a rough picture of whether the air conditioner is consuming too much or too little, cheap Tuya/Smart Life devices can be perfectly adequate.
But if your goal is true Energy Monitoring—that is, finding where your money is wasted, diagnosing network problems (voltage drops), or distributing costs to roommates and tenants—Shelly's ecosystem is unrivaled at the level of native applications. The analytics it gives you for free in your hand are reminiscent of industrial software.
Next Step: We mentioned the keyword: "Export files". Beautiful charts on mobile are good, but your accountant, your company or your tenant can't see your mobile screen.
We continue to the practical guide: Data Export (Export to CSV/Excel): How to output monthly cost reports for your roommates, accountant or business.
Return to category.
Go to categoryReturn to the central guide.
Go to guide