Sum for Absolute Accuracy
You can sum only the cells for the days or hours that matter. This is extremely useful if, for example, an Airbnb guest left at 2:00 pm and you want to charge electricity only up to that moment rather than for the full day.
The colorful graphs and mobile apps are fantastic for you, the user, to have daily supervision of your home. But what happens when you need to send that data to someone else?
Your company's accountant is not going to install Smart Life on a phone just to understand what consumed energy at the branch. Your roommate may not trust a simple screenshot from your app. And of course, the utility billing period rarely starts exactly on the 1st of the month and ends on the 31st, so the ready-made monthly graphs inside most apps do not align neatly with the provider's dates.
This is where energy monitoring becomes genuinely professional: data export. It is the point where app visuals turn into accounting-grade information. Let's see how to move the data out of the cloud and into your own spreadsheet.
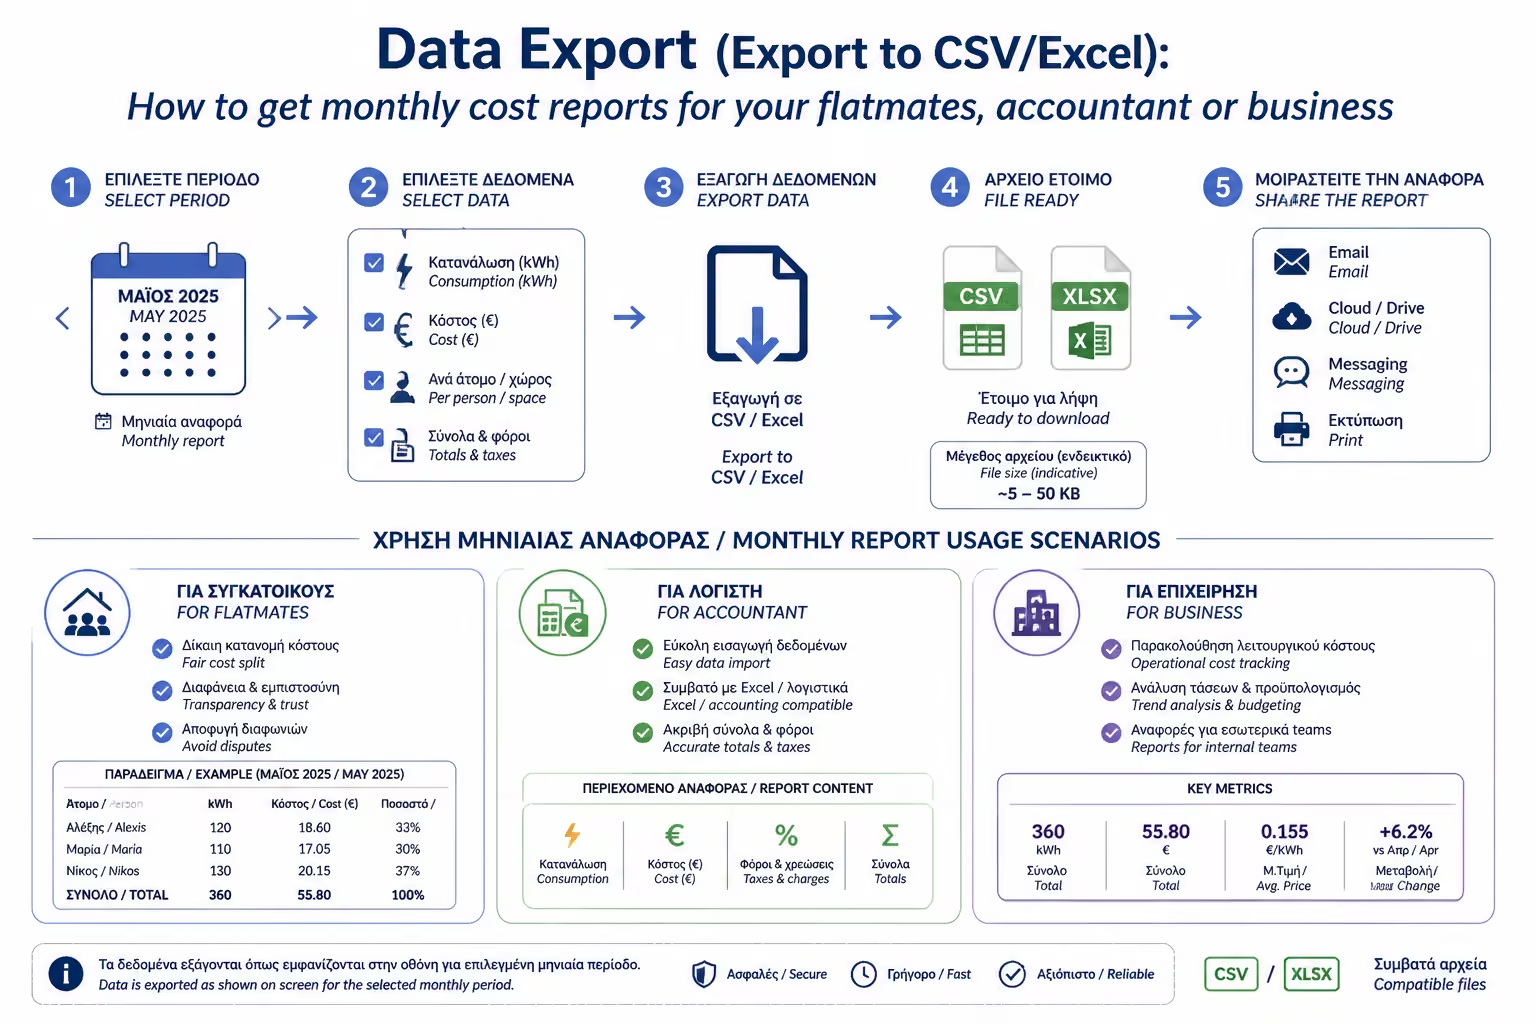
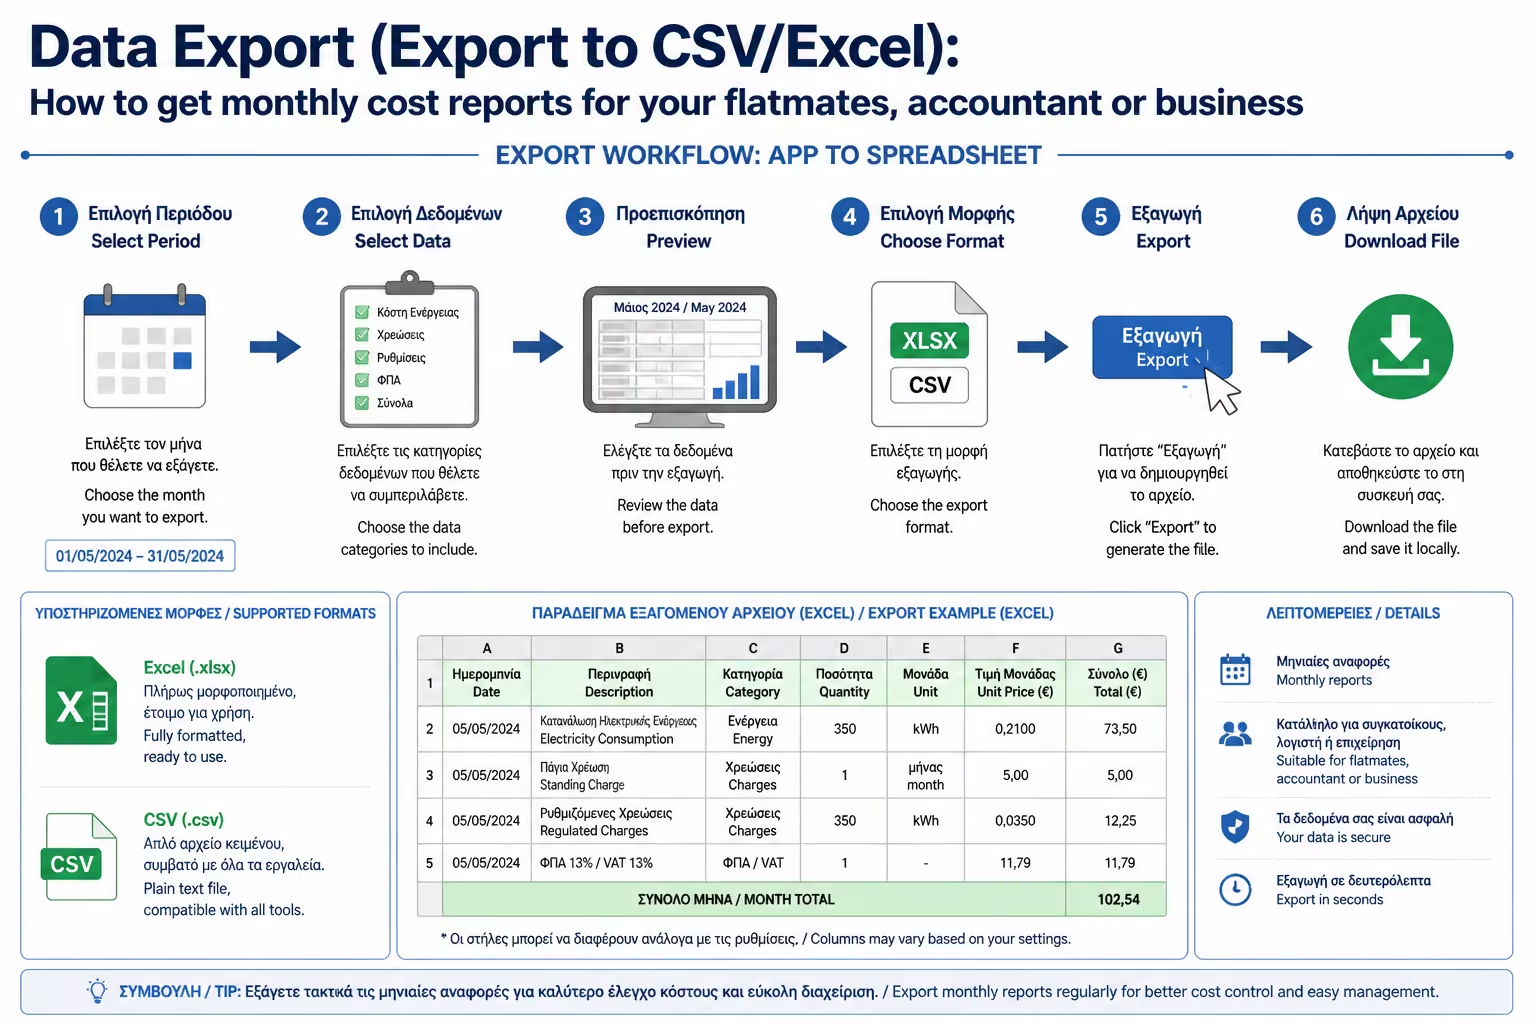
Almost all serious smart meter platforms (Shelly, Home Assistant, specialized Tuya platforms, etc.) give you a button that says "Export History" or "Download Data".
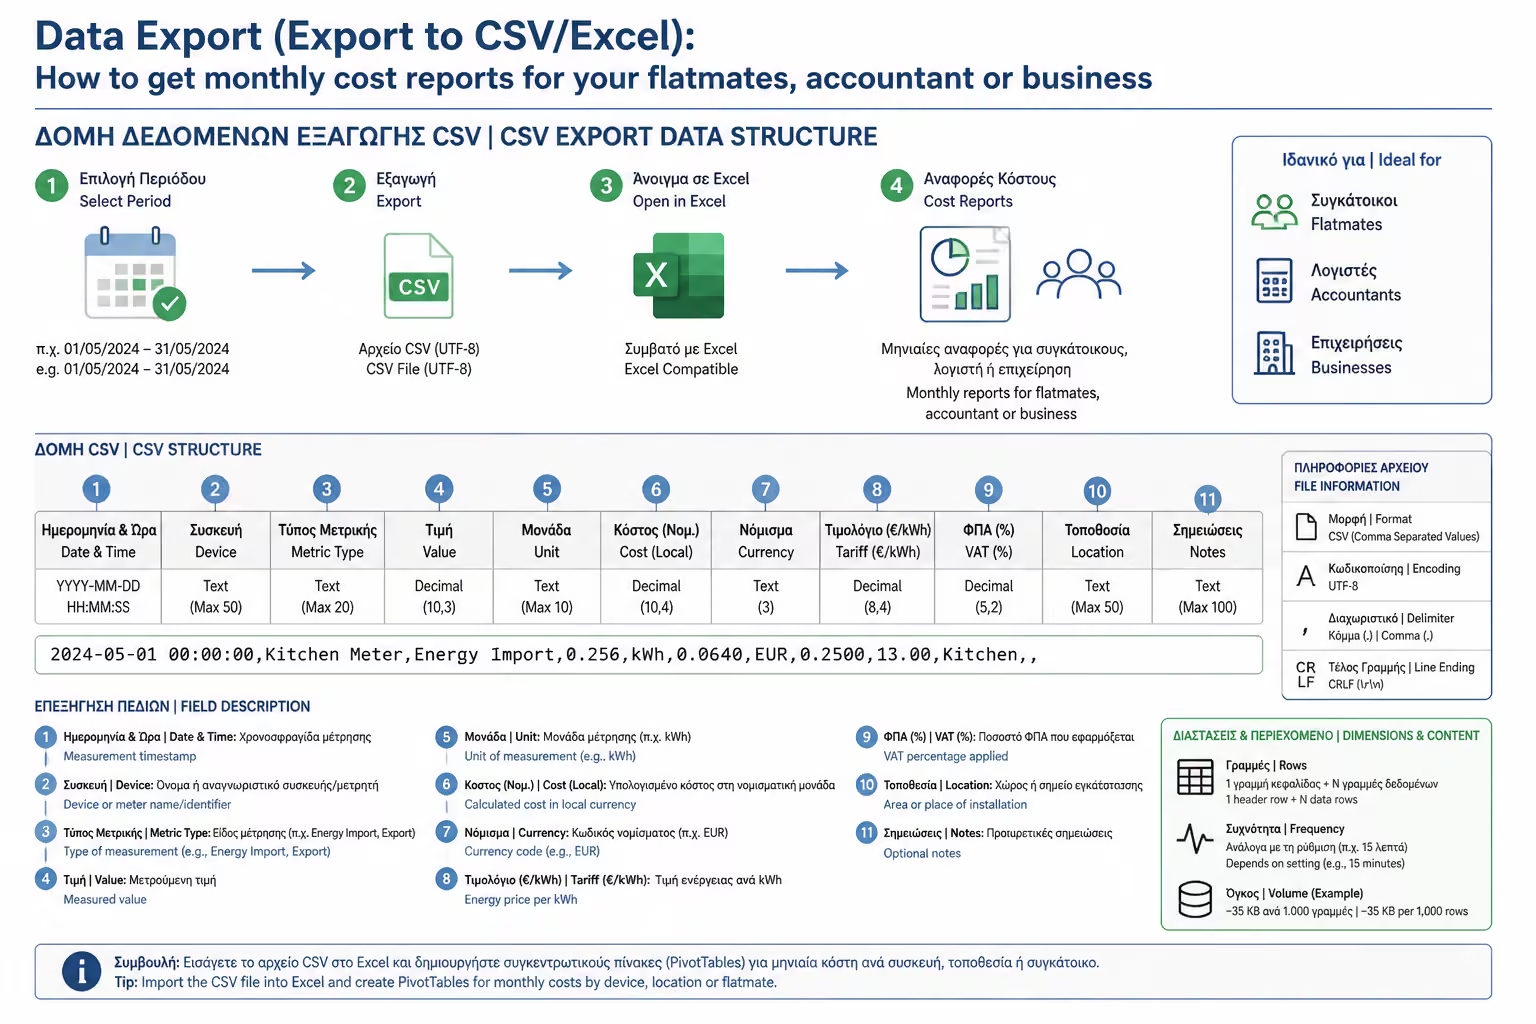
This button does not give you a word file or image. It gives you a CSV (Comma-Separated Values) file. CSV is the simplest, "bare" and universal data language. It looks like a simple text file, where the numbers are separated by commas. The magic about CSV is that it opens directly with Microsoft Excel, Google Sheets or Apple Numbers, instantly turning this text "download" into a neat table with columns and rows.
The process varies slightly depending on the manufacturer, but the logic is identical:
Once you open the CSV file in Excel, you will see columns like Date, Time, Energy (Wh or kWh). From now on, you are in complete control:
You can sum only the cells for the days or hours that matter. This is extremely useful if, for example, an Airbnb guest left at 2:00 pm and you want to charge electricity only up to that moment rather than for the full day.
Create a new column next to the kilowatt-hours column and apply a formula such as `=[kWh cell]*0.15`. By dragging the formula down, Excel calculates the cost in euros for each row automatically.
You can filter the data to see what happens only on weekends, or only during the night tariff hours (23:00 - 07:00) to calculate the reduced charge.
Data extraction solves the problem in 3 very specific cases:
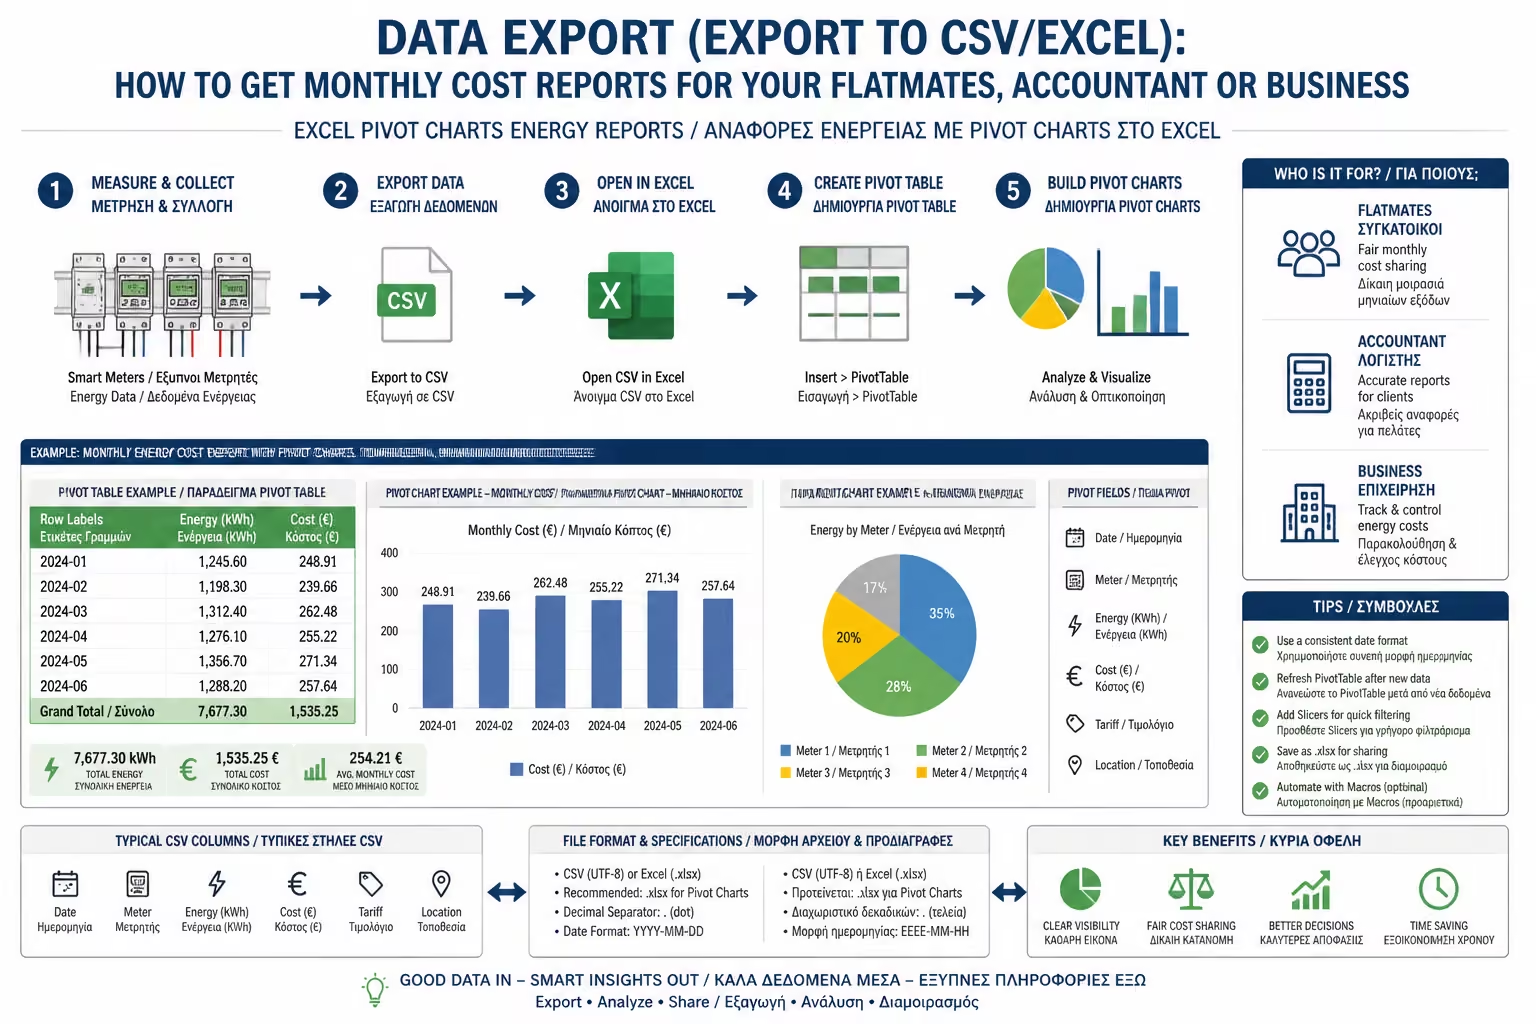
If you rent the basement or share a house, Excel is your best friend. You take the CSV, make a nice table showing your daily consumption, add a little graph (pie) from Excel, and export it as a PDF. Now, you are not sending a "dry" number to the tenant, but an official, professional Report that gives credibility and transparency.
For businesses housed in the same building, the Facility Management administrator downloads the CSVs of all sub-counters (Office 1, Office 2, Warehouse). He sends them to the accounting department, which uses Pivot Tables to "cut" utility and power sharing tariffs to the individual companies, based on hard data, not "estimates" of square meters.
We have all felt the doubt whether the electricity provider (or the grid operator employee who took the measurement) was wrong. With Excel, you can get the sum of the days the bill is written and compare it directly to your own number. If you see a huge discrepancy, the Excel file is your first piece of evidence to appeal.
Smart Home is not just for turning on the lights from the couch. It is a data generator. If you learn to export your history to a simple Excel file, you get a powerful cost management tool that will save you from misunderstandings, injustices and "inflated" bills.
Next Step: We saw how we analyze the data after the month has passed. But what if something goes wrong now? If the oven was left on while you were gone for work?
We continue with perhaps the most useful "saving" feature of the smart home: Push Notifications: How to receive a message on the mobile phone if the oven was left on or the refrigerator stopped working.
Return to category.
Go to categoryReturn to the central guide.
Go to guide